
This dashboard provides key metrics on activist engagement, including participation, donation activity, inactivity, and fundraising performance.
Dashboard
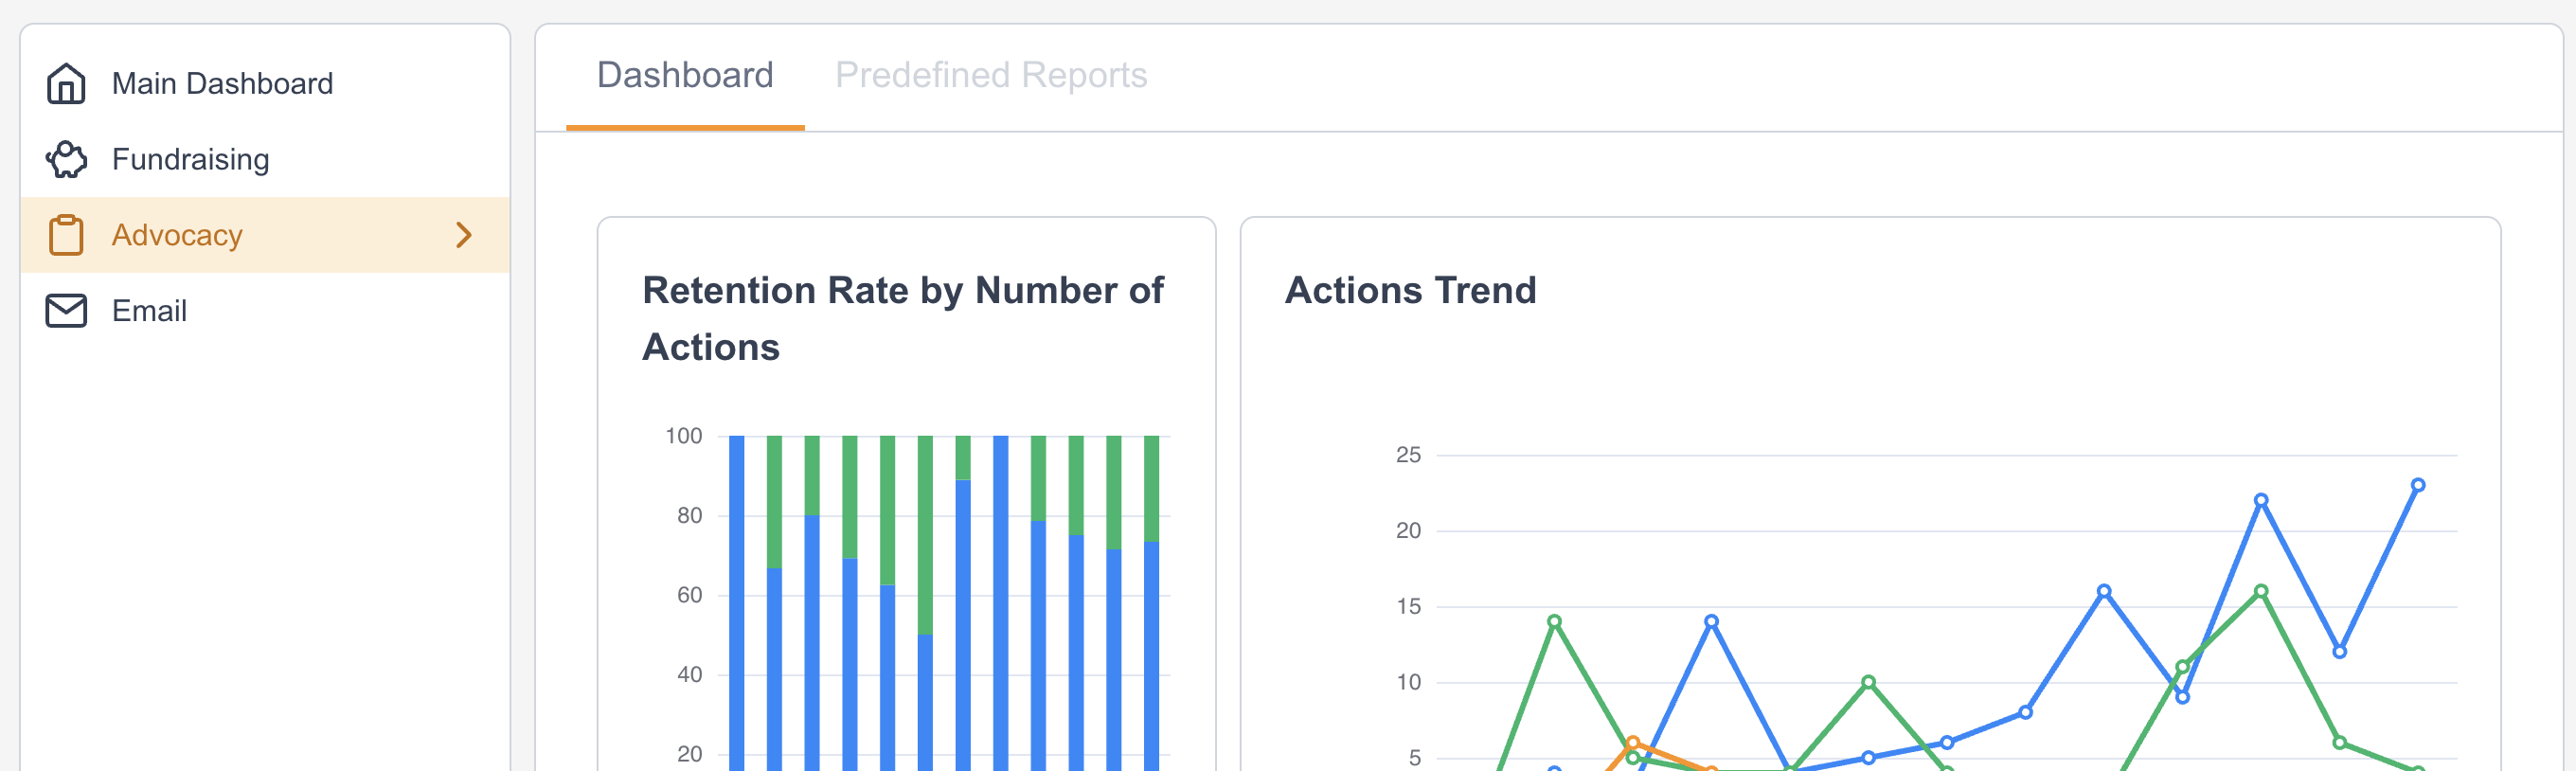
The Dashboard includes the a variety of widgets that are part of other, more comprehensive reports. You can access the full report from each widget by selecting ![]()
|
Widget |
Description |
Predefined Report |
|---|---|---|
|
Retention Rate by Number of Actions 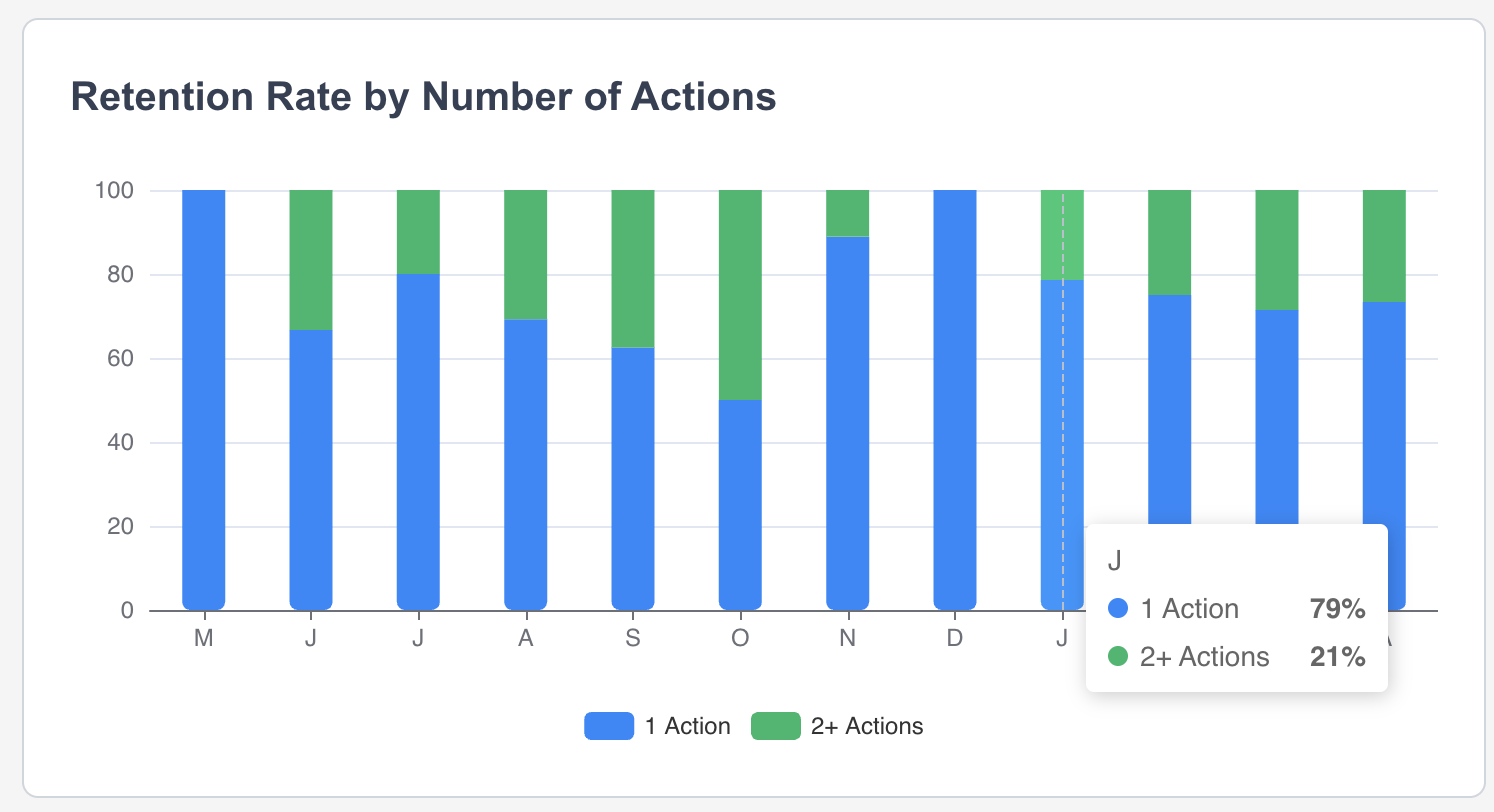
|
Analyzes supporter retention based on their level of activity, showing the link between engagement and long-term support. |
|
|
Actions Trend 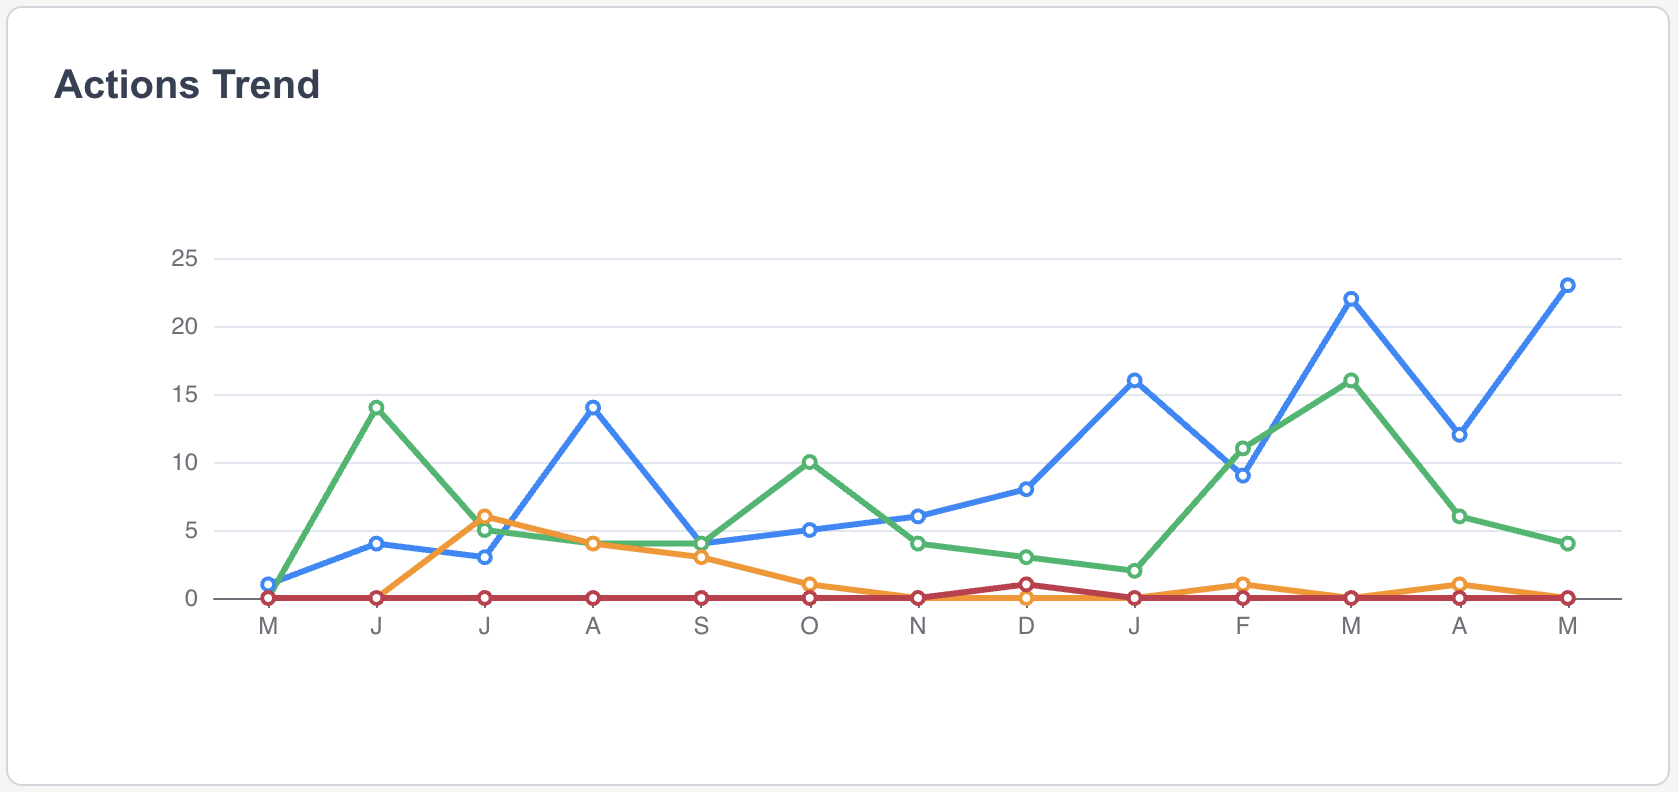
|
Shows trends over time in the number of supporter actions taken (e.g., petitions, form submissions), revealing advocacy engagement levels.
|
|
|
Actions by Page 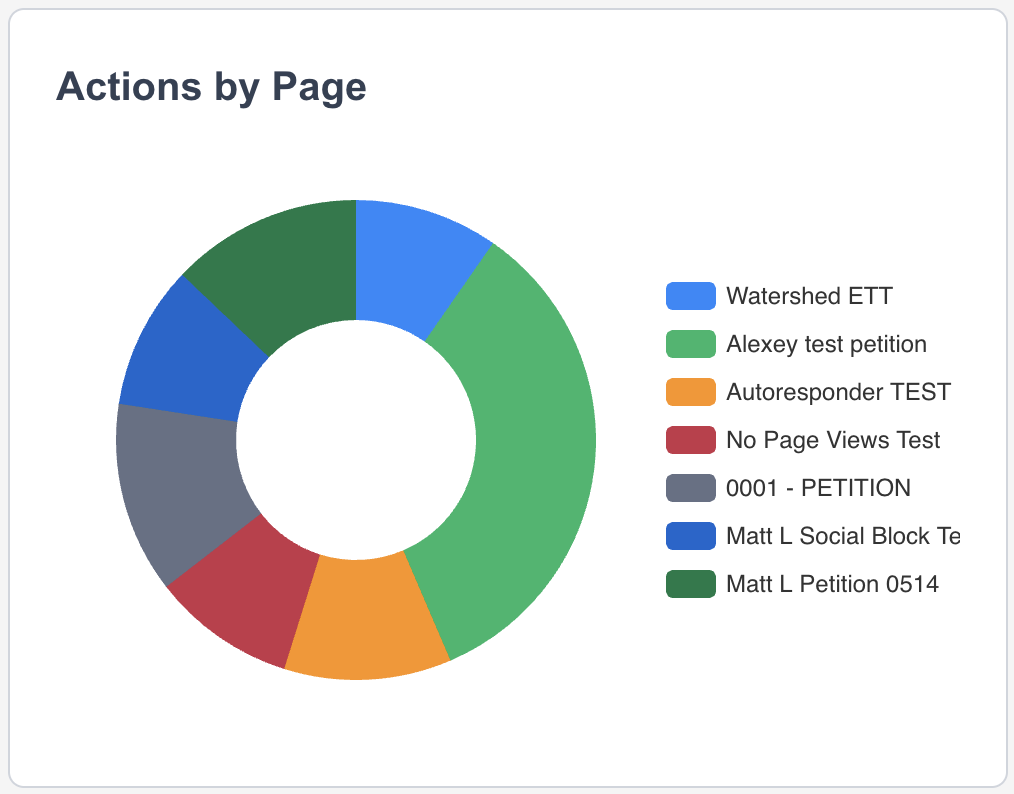
|
Displays the volume of supporter actions segmented by originating page, highlighting high-performing content. |
|
|
Supporter Mix 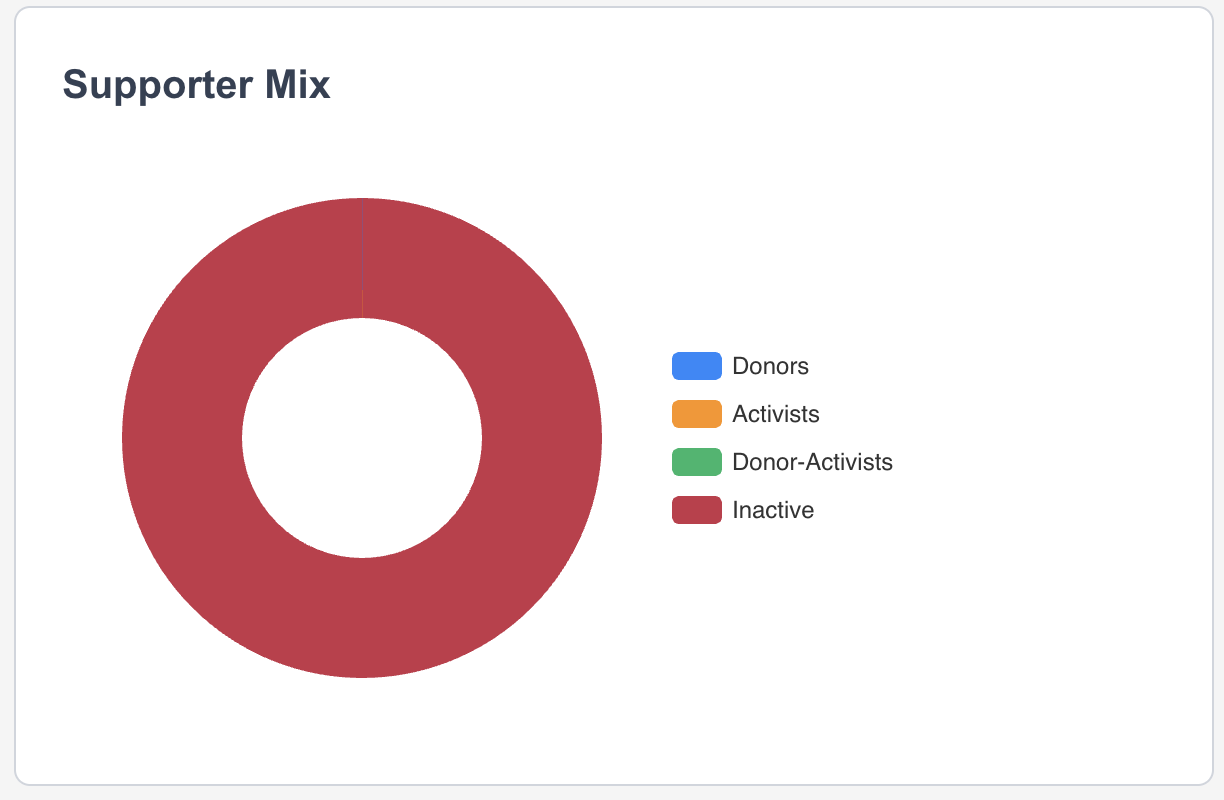
|
Breaks down the supporter base by type (e.g., donors, activists), showing audience composition. |
|
|
Mapping of Advocacy Activity 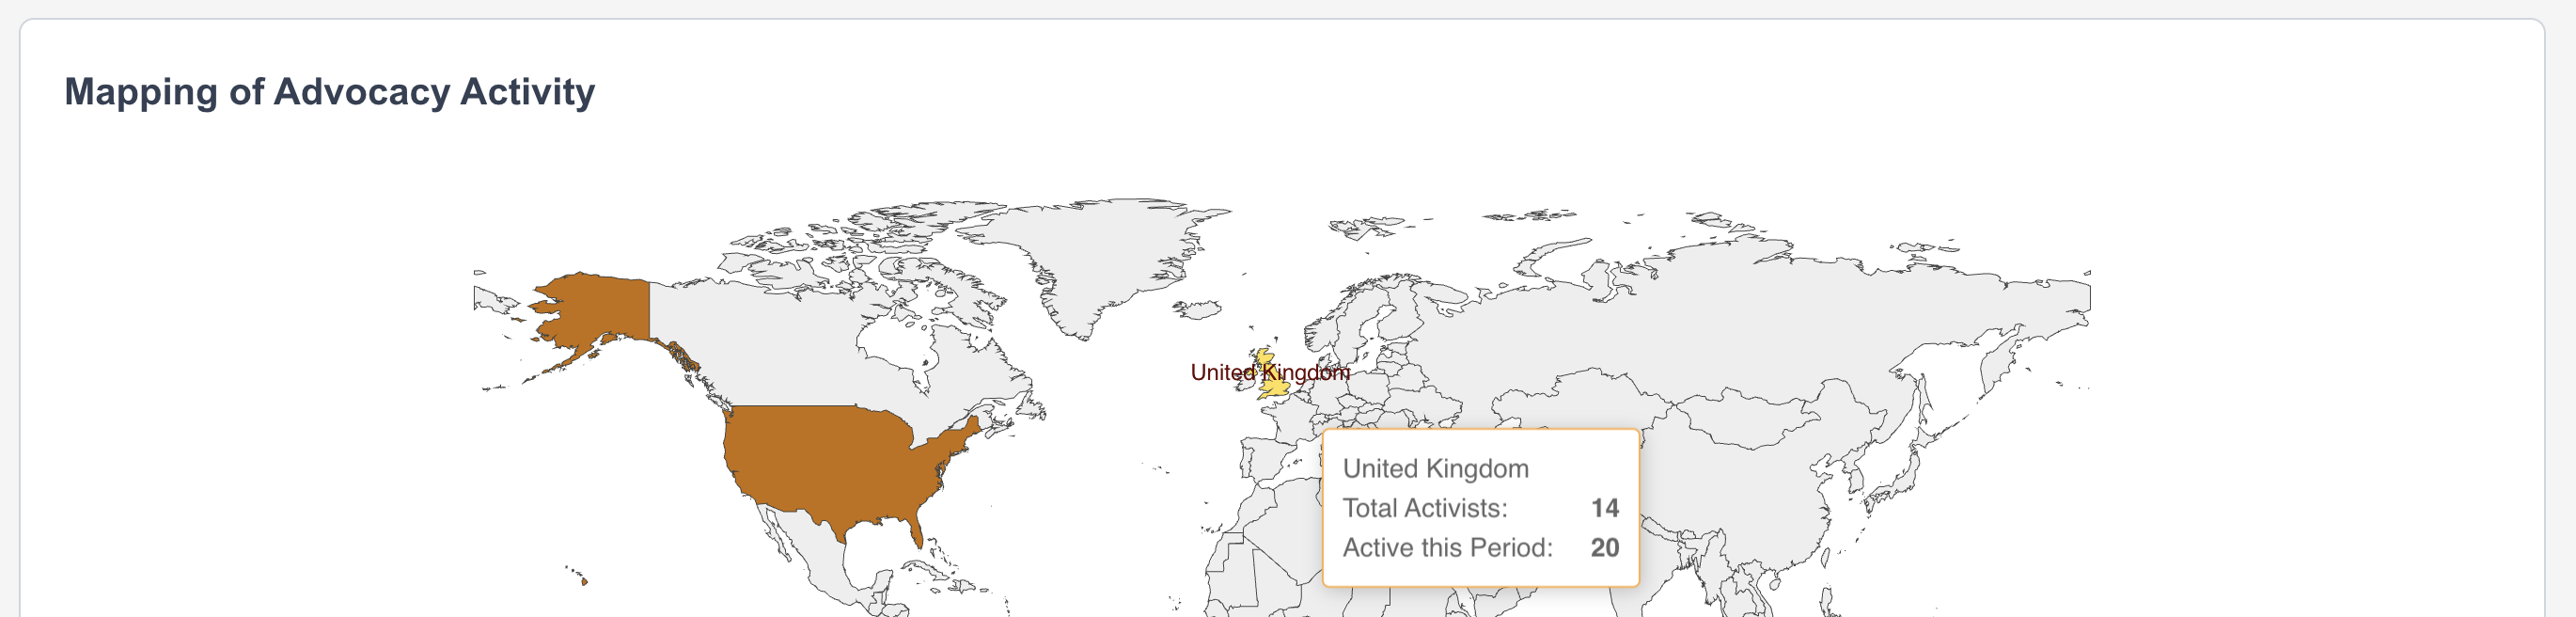
|
Visualizes the geographic distribution of advocacy actions, helping to track regional campaign impact. |
Predefined Reports
This will list the full reports associated with each widget shown the dashboard.
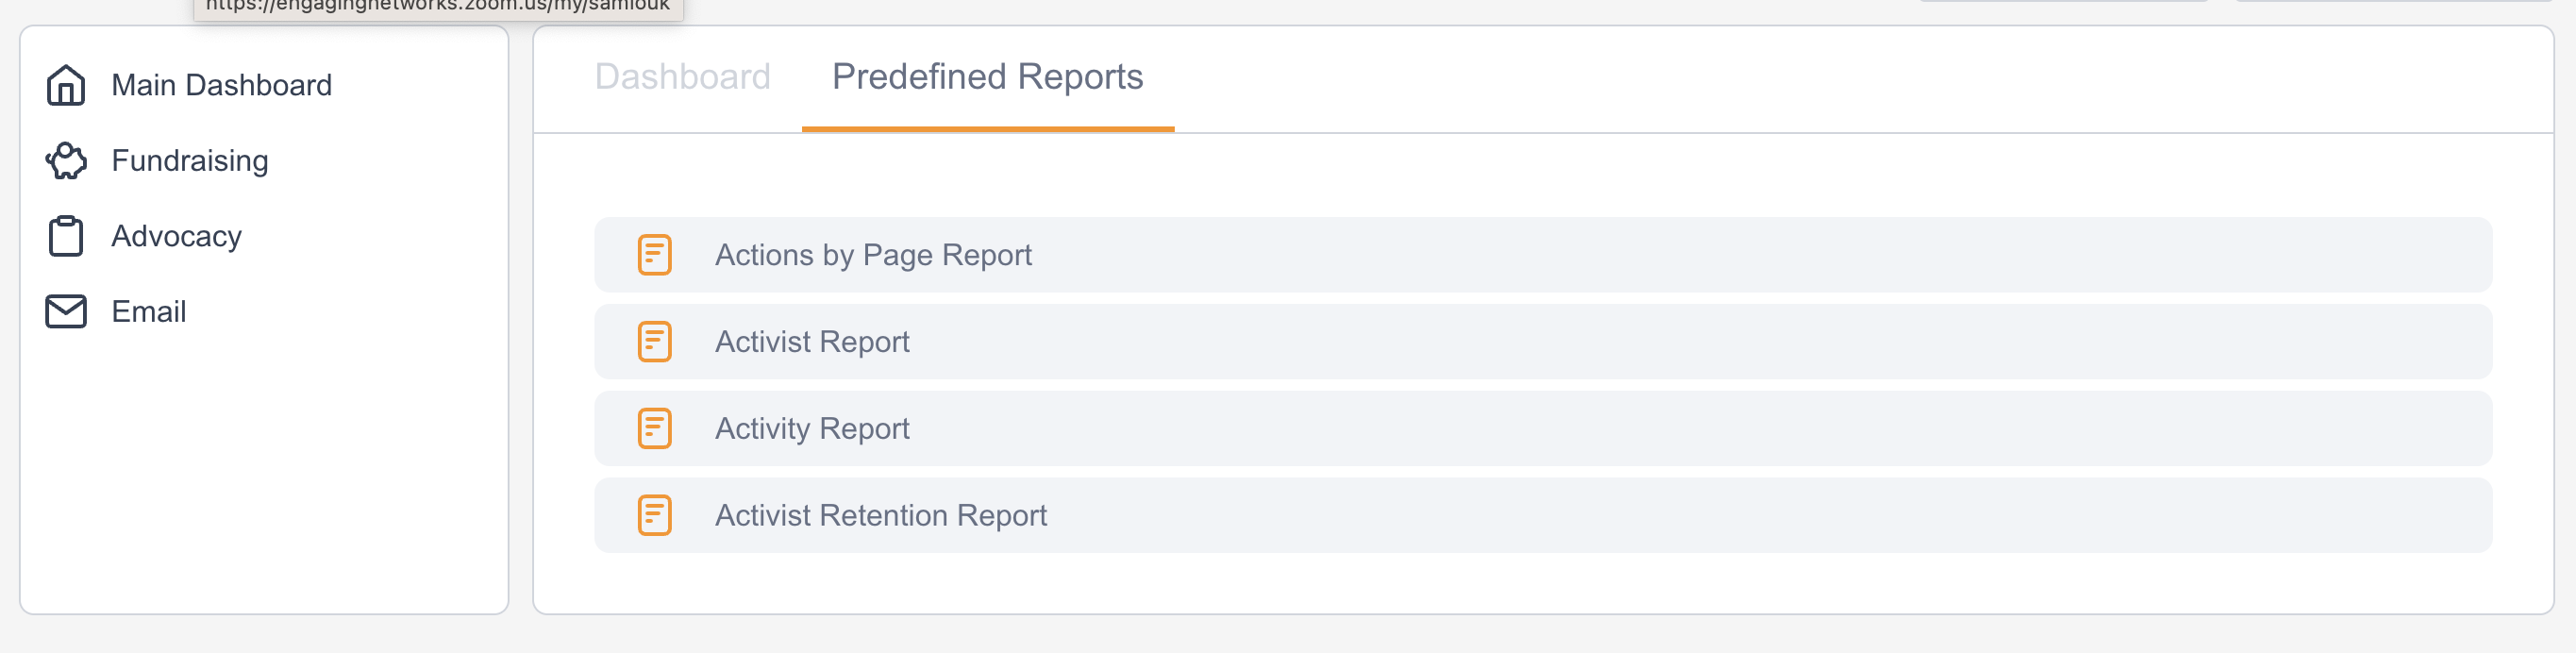
Activist Report
This report provides key metrics on activist engagement, including participation, donation activity, inactivity, and fundraising performance.
Metric
|
Description |
|---|---|
|
Number of Activists |
The total number of activists based on the selected segment and date filter. |
|
Average Number of Actions Taken per Activists |
The average number of actions taken per activist based on the selected segment and date filter. |
|
Number of Activist Donors |
The total number of activists who have made at least one gift based on the selected segment. |
|
Number of Inactive Activists |
The total number of inactive activists based on the selected segment and date filter. |
|
Total Raised from Activist Donors |
The total raised from activists who have made at least one gift based on the selected segment. |
|
Average Donation Amount from Activist Donors |
The average donation amount from activist donors based on the selected segment and date filter. |
|
Activist Actions 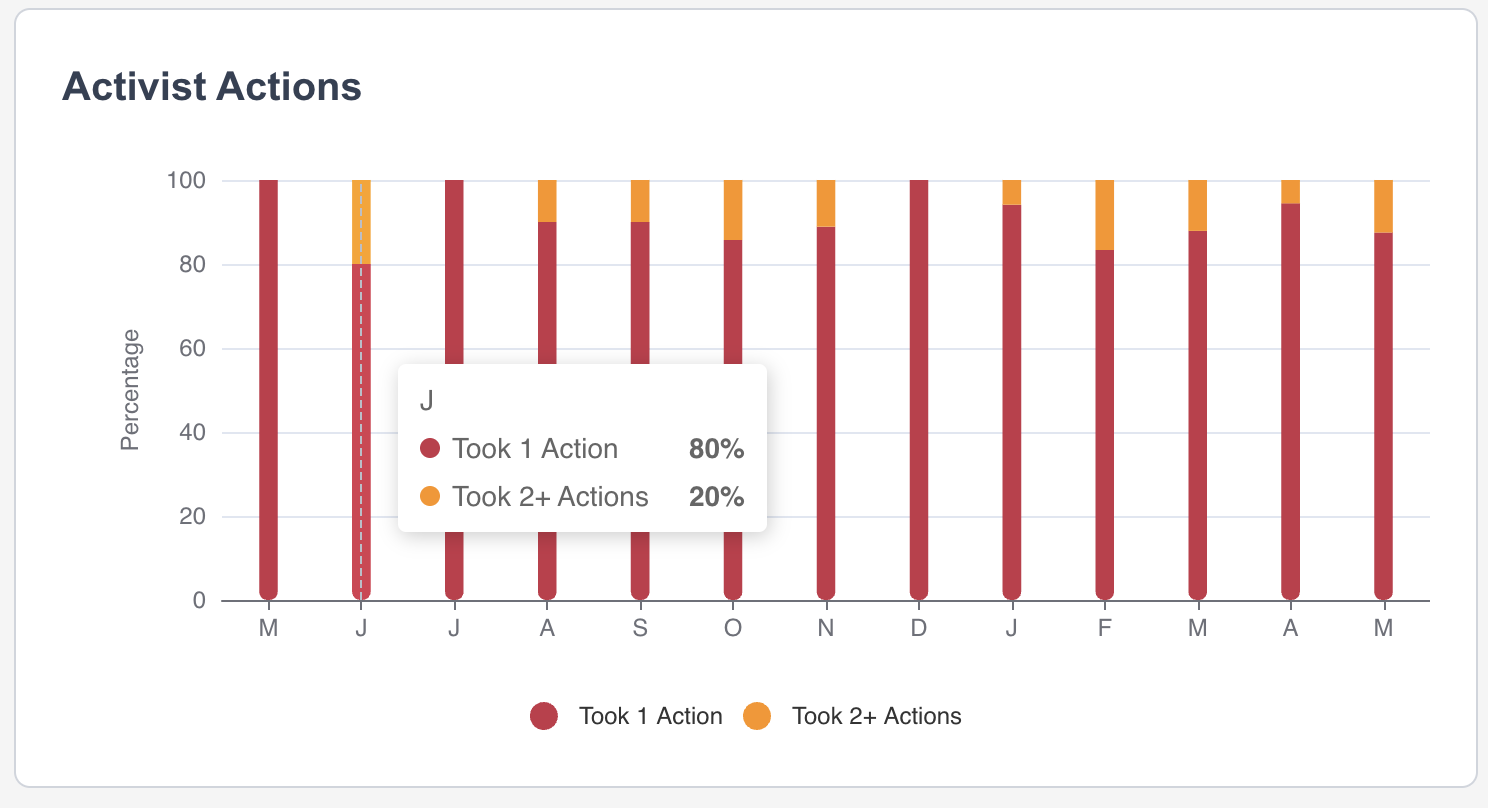
|
Visualizes the percentage of activist who took one more actions over time. |
|
Supporter Mix
|
Visualizes the geographic distribution of advocacy actions, helping to track regional campaign impact.
|
Sample data reporting
|
Field |
Definition |
|---|---|
|
First, Last, Email |
Personal information of the supporter. |
|
City, Region, Country |
Address information of the supporter. |
|
Last Activity by Supporter |
The last activity performed by the supporter. |
|
Date of Last Activity for Supporter |
The date when the last activity took place for the supporter. |
|
Total Actions |
The total number of actions performed by the supporter. |
|
Is Donor |
Whether the supporter is a donor. |
|
Last Donation Date |
The date when the last donation was made. |
|
Last Donation Amount |
The amount of the last donation made by the supporter. |
|
Donation Currency |
The currency in which the last donation was made. |
|
Total Donations |
The total number of donations made by the supporter. |
|
Average Donation Amount |
The average amount donated per donation. |
|
Highest Donation Amount |
The highest amount donated in a single donation. |
|
Fee Cover Amount |
The amount covered by the supporter to cover transaction fees. |
Actions by Page
This report highlights user engagement across action pages, detailing action types, their distribution, and average actions per user.
|
Metric |
Description |
|---|---|
|
Number of Actions |
The total number of actions by supporter based on the selected segment and date filter. |
|
Petition % |
The percentage of petitions from all actions based on the selected segment and date filter. |
|
ETT % |
The percentage of Email to Target from all actions based on the selected segment and date filter. |
|
CTT % |
The percentage of Call to Target from all actions based on the selected segment and date filter. |
|
X to Target % |
The percentage of X to Target from all actions based on the selected segment and date filter. |
|
Average Number of Actions per User |
The average number of actions per user based on the selected segment and date filter. |
|
Actions by Page
|
Actions by page based on the selected segment and date filter. Users can hover over the chart to display number of actions for specific pages |
|
Actions Trend
|
Actions over time by campaign type based on the selected segment and date filter. Users can hover over the chart to display number of actions for specific pages |
Sample data reporting
|
Field |
Definition |
|---|---|
|
Campaign |
Name of campaign |
|
Type |
Type of campaign (e.g. Petition, Click to Call) |
|
Created |
Date campaign was created |
|
Number of Supporters |
Number of supporters who participated in the campaign |
|
Number of Actions |
Number of combined actions for the campaign |
Activist Retention Report
This report provides key insights into activist retention, focusing on the overall retention rates and action-level engagement over the last 12 months.
|
Metric |
Description |
|---|---|
|
Retention Rate |
The percentage of activists in the last 12 months compared to the previous 12 months. |
|
Number of Activists |
The total number of activists based on the selected segment. |
|
Activists Who Took 1 Action |
The total number of activists who took 1 action based on the selected segment. |
|
Activists Who Took More Than 1 Action |
The total number of activists who took more than 1 action based on the selected segment. |
|
Activists Who Took 1 Action (%) |
The percentage of total activists who have only taken 1 action based on the selected segment. |
|
Activists Who Took More Than 1 Action (%) |
The percentage of total activists who have taken more than 1 action based on the selected segment. |
|
Retention Rate by Number of Actions
|
Analyzes supporter retention based on their level of activity, showing the link between engagement and long-term support. |
|
Activist Retention 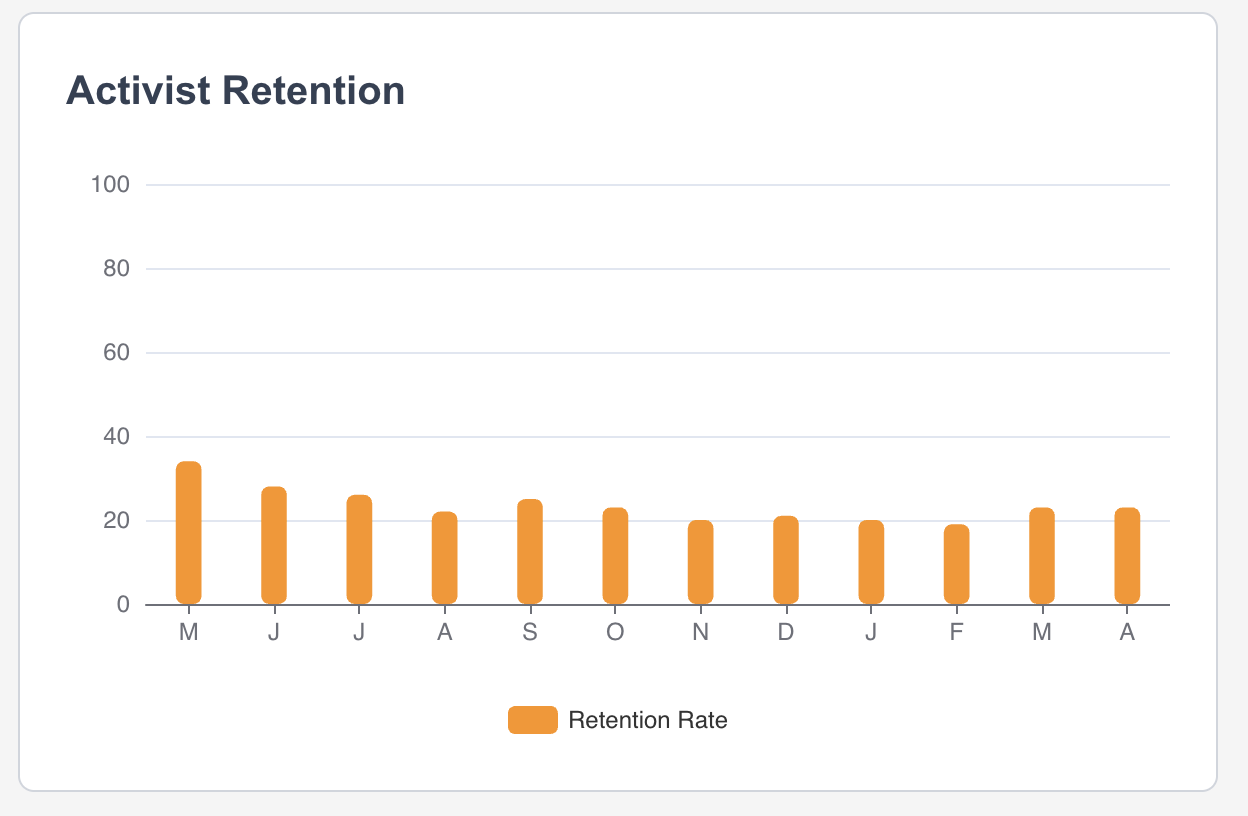
|
The percentage of activists who participated in the the time period compared to the same time frame previously. |
Sample data reporting
|
Field |
Definition |
|---|---|
|
First, Last, Email |
Personal information of the supporter. |
|
City, Region, Country |
Address information of the supporter. |
|
Last Activity by Supporter |
The last recorded action taken by the supporter. |
|
Date of Last Activity for Supporter |
The date the supporter last took an action. |
|
Total Actions (Lifetime) |
The total number of actions taken by the supporter over their lifetime. |
Advocacy Activity Report
This report summarizes advocacy activity, highlighting activist participation, activity levels, and top-performing regions.
|
Metric |
Description |
|---|---|
|
Activist Count |
The total number of activists based on the selected segment and date filter. |
|
Active Rate |
The number of active activists divided by the total number of activists. |
|
Most Active [Country/State/Area] |
The most active country or state or area based on the selected segment and date filter. |
|
Mapping of Advocacy Activity
|
|
Sample data reporting
|
Field |
Definition |
|---|---|
|
Country |
The country where the activists are located. |
|
Total Activists |
The total number of activists in the country. |
|
Average Actions Per Page |
The average number of actions taken per action page by activists in the country. |
|
Number of Actions |
The total number of actions taken by activists in the country. |
|
Number of Activists |
The count of individual activists who took at least one action in the country. |
|
Number of Donor Activists |
The number of activists who made at least one donation in the country. |