
This dashboard provides a comprehensive view of email performance and supporter engagement, tracking delivery, engagement, fundraising impact, and unsubscribe trends.
Dashboard
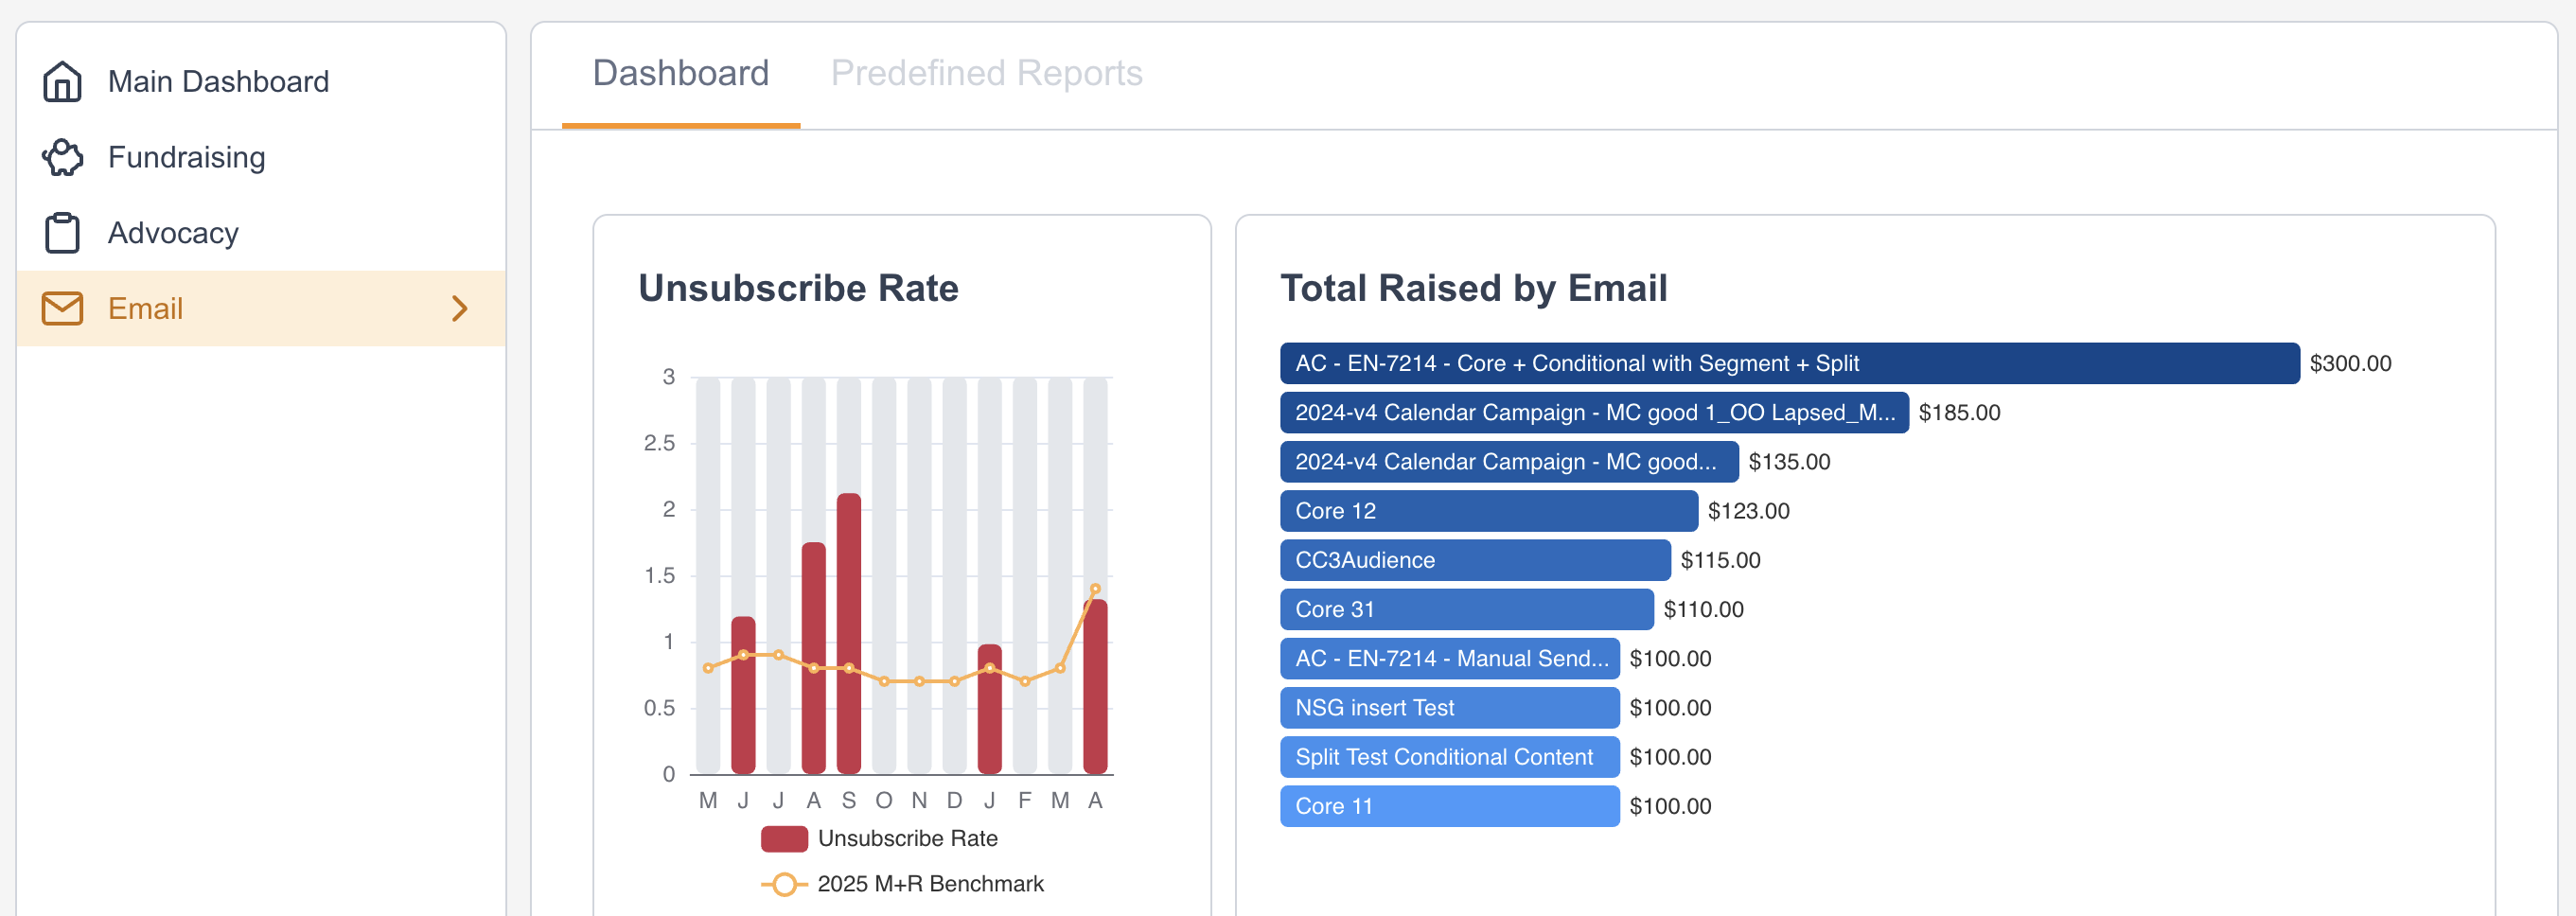
The Dashboard includes the a variety of widgets that are part of other, more comprehensive reports. You can access the full report from each widget by selecting

|
Widget |
Description |
Predefined Report |
|---|---|---|
|
Unsubscribe Rate 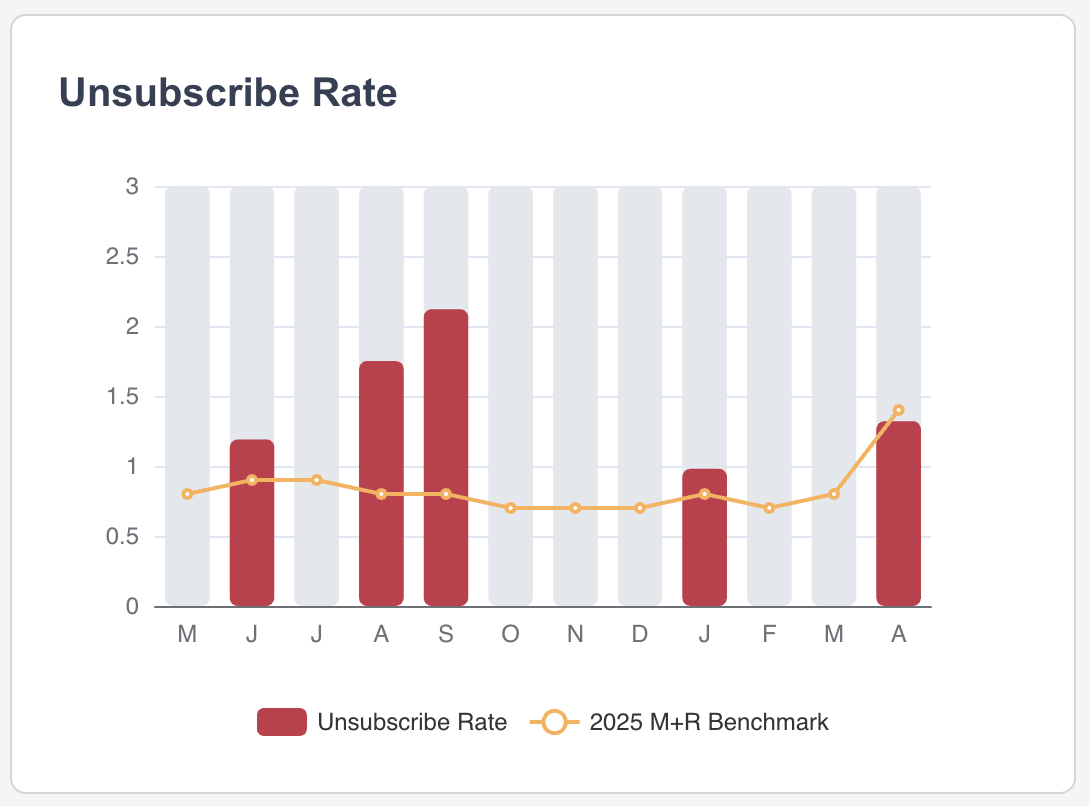
|
Measures the percentage of email recipients who opted out after receiving a campaign. Indicates email fatigue or relevance issues. |
|
|
Total Raised by Email 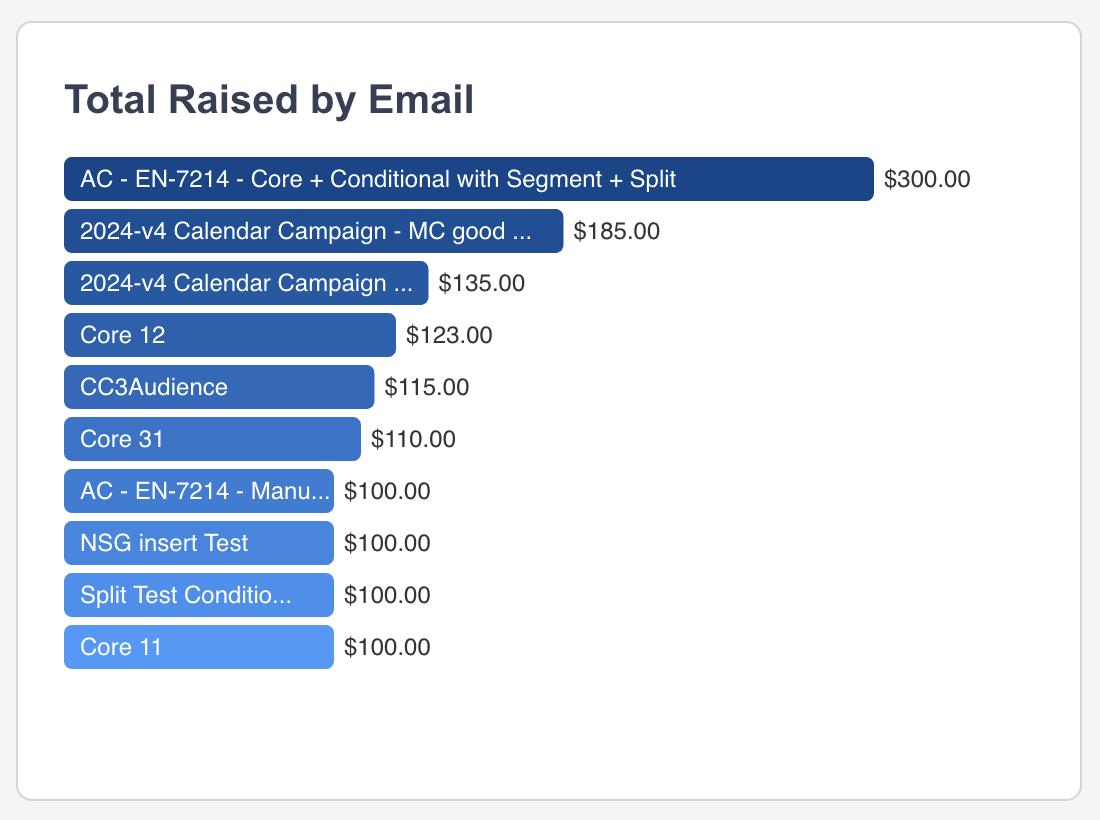
|
Breaks down total revenue generated directly from email campaigns (classic and MT) to assess their effectiveness in driving donations
|
|
|
Email Performance 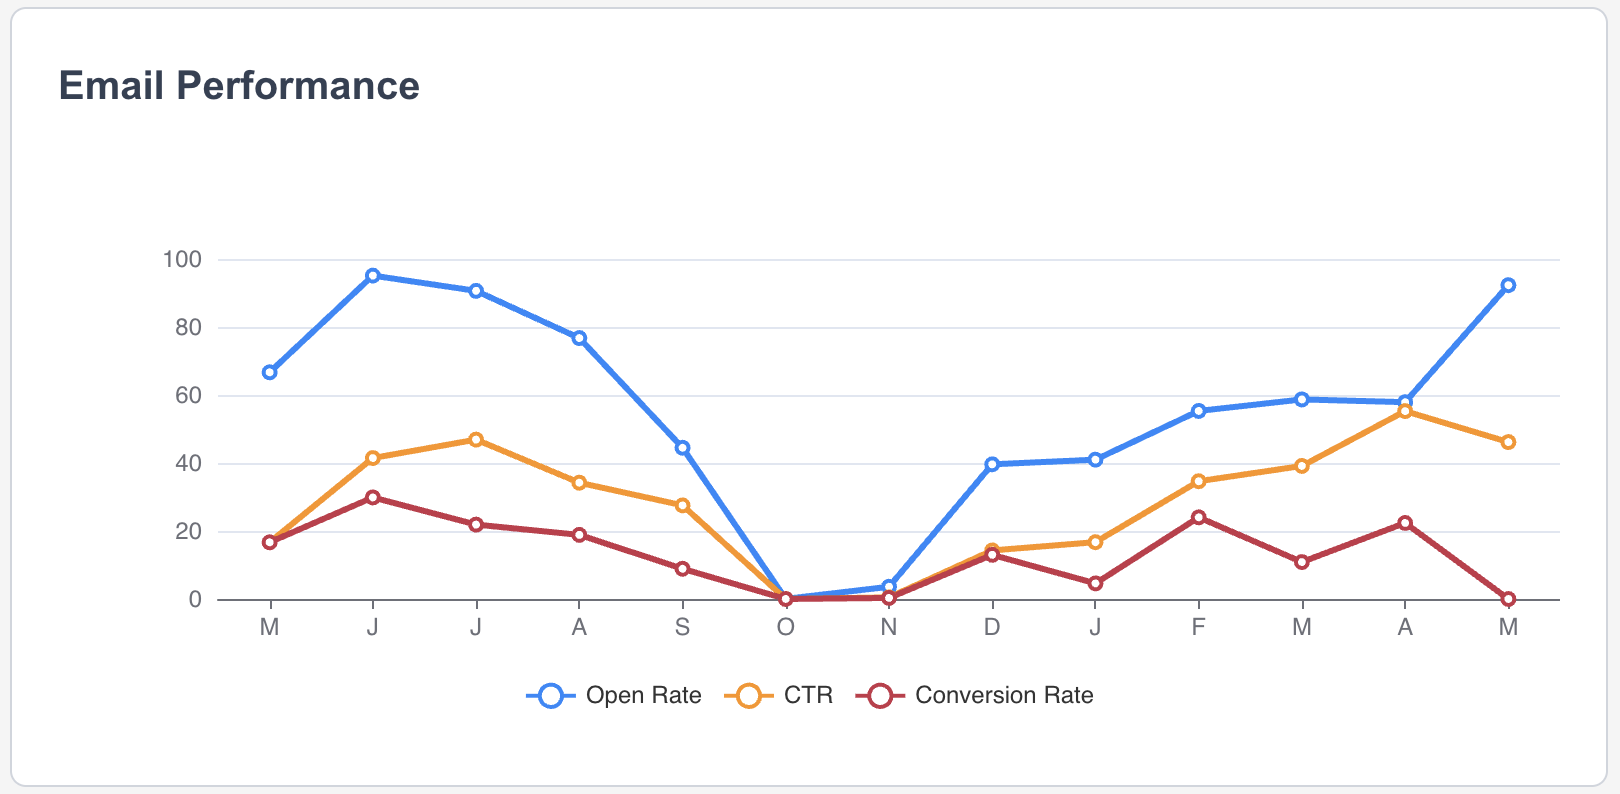
|
Displays the open, click through and conversation rate for emails over time. |
|
|
Engagement Score 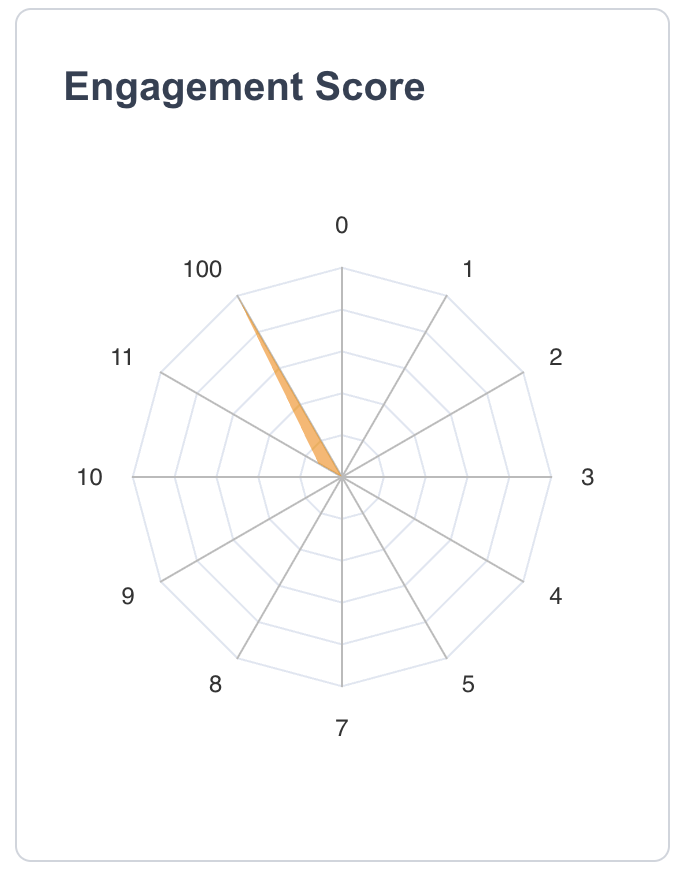
|
Combines various supporter behaviors into a composite score to measure overall engagement.
|
Predefined Reports
This will list the full reports associated with each widget shown the dashboard.

Unsubscribed Supporters Report
This report focuses on unsubscribe trends and supporter lifespan.
|
Metric |
Description |
|---|---|
|
Unsubscribe Rate |
The unsubscribe rate for all emails (including marketing automation emails) based on the selected segment and date filter. |
|
Average Supporter Lifespan (Months) |
The average supporter lifespan from the creation of supporter to the supporter receiving their last email. |
|
Average Time Since Last Email (Months) |
The average time in months since last email received based on the selected segment. |
|
Unsubscribe Rate 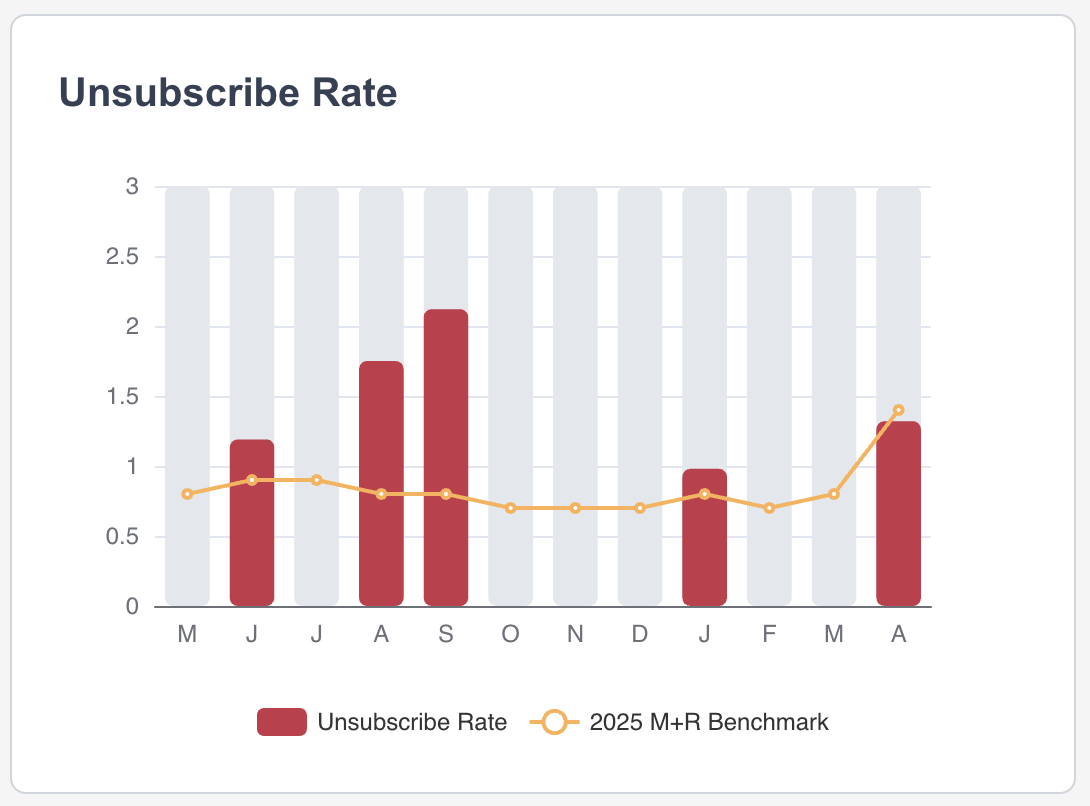
|
Measures the percentage of email recipients who opted out after receiving a campaign. Indicates email fatigue or relevance issues.
|
|
Unsubscribes by Email 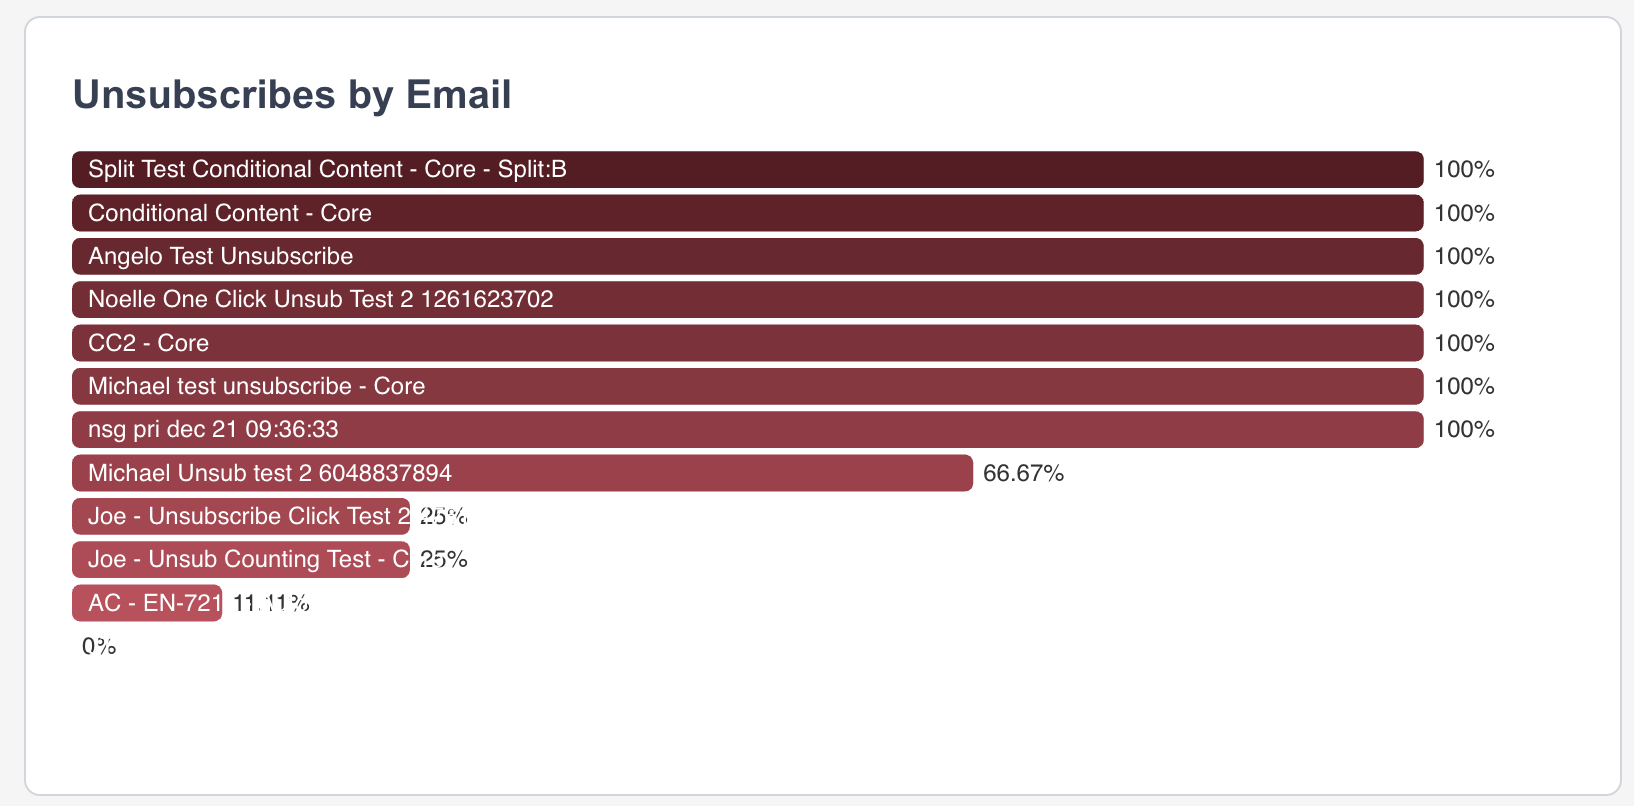
|
Lists the percentage of unsubscribes for each email campaign to identify messages that may cause disengagement.
|
Sample data reporting (produces 100 sample rows of data)
|
Field |
Definition |
|---|---|
|
First Name |
The supporter’s first name. |
|
Last Name |
The supporter’s last name |
|
|
The supporter’s email address. |
|
City |
The city where the supporter resides. |
|
Region |
The state, province, or region of the supporter. |
|
Country |
The country where the supporter is located. |
|
Is Donor? |
Indicates whether the supporter has made a financial donation (Y/N). |
|
Is Activist? |
Indicates whether the supporter has participated in advocacy actions (Y/N). |
|
Last Action Date |
The date of the supporter’s most recent action (e.g., donation, petition, event signup). |
|
Unsubscribe Date |
The date the supporter unsubscribed from receiving further emails. |
|
Supporter Lifespan (Months) |
The total number of months from when the supporter was added to the database to their last action/email. |
|
A numeric score representing the supporter’s overall level of engagement. |
|
|
Last Email Unsubscribed From |
The name of the last email that led the supporter to unsubscribe. |
|
Time Since Last Email (Days) |
The number of days since the supporter last received an email. |
Email Performance Report
This report assesses email campaign effectiveness by tracking delivery, engagement, conversion, fundraising outcomes, and recipient feedback metrics.
|
Metric |
Description |
|---|---|
|
Sent |
The number of sent emails based on the selected date filter. |
|
Delivered |
The number of delivered emails based on the selected date filter. |
|
Open Rate |
The open rate based on the selected date filter. |
|
Click Through Rate |
The click through rate based on the selected date filter. |
|
Unsubscribe Rate |
The unsubscribe rate based on the selected date filter. |
|
Conversion Rate |
The conversion rate based on the selected date filter. |
|
Total Raised |
The total raised based on the selected date filter. |
|
Number of Complaints |
The total number of complaints based on the selected date filter. |
|
Bounce Rate |
The soft and hard bounce rate based on the selected date filter. |
|
Revenue Per Thousand Emails |
The amount raised for every 1,000 email recipients based on the selected date filter. |
|
Total Raised by Email
|
Breaks down total revenue generated directly from email campaigns (classic and MT) to assess their effectiveness in driving donations
|
|
Email Performance
|
Displays the open, click through and conversation rate for emails over time. |
Sample data reporting
|
Field |
Definition |
|---|---|
|
Name |
The title of the email campaign. |
|
Create Time |
The date and time the email campaign was created. |
|
Category |
The type or classification of the email (e.g., fundraising, advocacy, newsletter). |
|
Sent |
The total number of emails sent in the campaign. |
|
Delivered |
The number of emails successfully delivered (Sent - Bounces). |
|
Opened |
The number of recipients who opened the email. |
|
Open Rate |
The percentage of delivered emails that were opened: |
|
Total Clicks (All Links) |
The total number of clicks on all links within the email. |
|
Click Through Rate |
The percentage of delivered emails that had at least one link clicked: |
|
Clicks/Opens Rate |
The percentage of opened emails that had at least one link clicked: |
|
Conversion Rate |
The percentage of recipients who completed a desired action (e.g., donation, signup): |
|
Unsubscribed |
The number of recipients who unsubscribed after receiving this email. |
|
Unsubscribe Rate |
The percentage of recipients who unsubscribed: |
|
Bounces (hard) |
The number of emails that permanently failed to deliver (e.g., invalid address). |
|
Bounces (soft) |
The number of emails that temporarily failed to deliver (e.g., mailbox full, server issues). |
|
Total Bounces |
The sum of hard and soft bounces. |
|
Bounce Rate |
The percentage of sent emails that bounced: |
|
Complaints |
The number of recipients who marked the email as spam or reported it. |
|
Number of Donors |
The number of unique individuals who donated as a result of the email. |
|
Total Raised |
The total dollar amount raised from the email campaign. |
|
Total Single Raised |
The total amount raised from one-time donations. |
|
Total Recurring Raised |
The total amount committed through recurring donations. |
|
Average Single Gift |
The average value of one-time gifts: |
|
Advocacy Count |
The number of advocacy actions taken (e.g., petition signed, letter sent). |
|
Engagement Count |
The total number of meaningful interactions (e.g., shares, form submissions, video views). |
Opt-ins Report
This report provides a comprehensive overview of new supporter opt-ins including average time to donate, average time to take an action, and opt-in sources. You must select an opt-in question to base the report on, which when combined with the date filter, the report will retrieve data for supporters who opt-ed in based on that question during the specified period
|
Metric |
Description |
|---|---|
|
New Supporters Opt-in Rate |
Percentage of new supporters who newly opted in. New opt-in is defined as new supporter who newly opted-in (supporter date creation and opt-in date are the same)
|
|
Average Time to First Action (Months) |
Average time (months) it took for newly opted in supporters to take any action during the date period |
|
Average Number of Actions |
Number of actions on average supporters took during the date period |
|
Average Time to Donate (Months) |
Average time (months) it took for newly opted in supporters to donate during the date period |
|
Average First Donation Amount |
Average first donation (single/recurring) amount supporters made during the date period |
|
Revenue Per New Opt-In |
Total donations (single/recurring) made by supporters during the date period |
|
New Supporter Opt-ins by Page 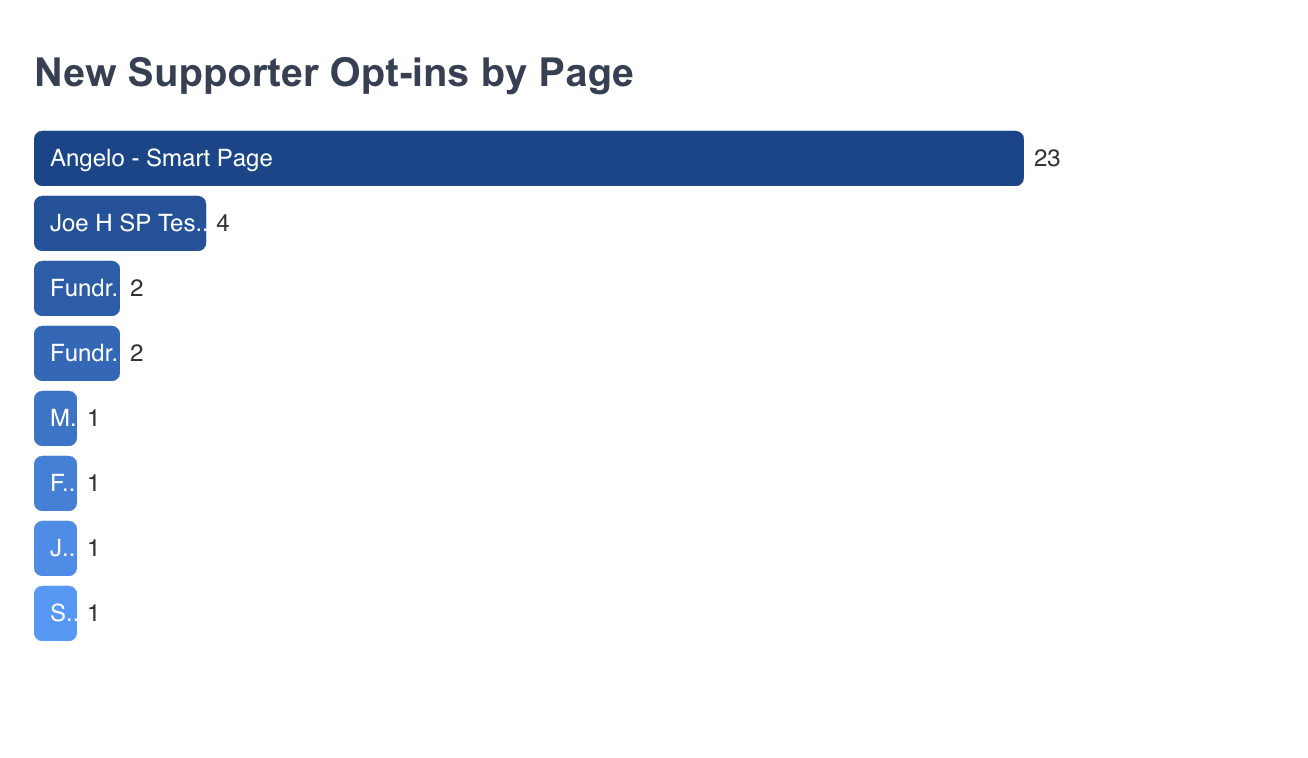
|
Number of opt ins by page |
|
Opt in Type Breakdown 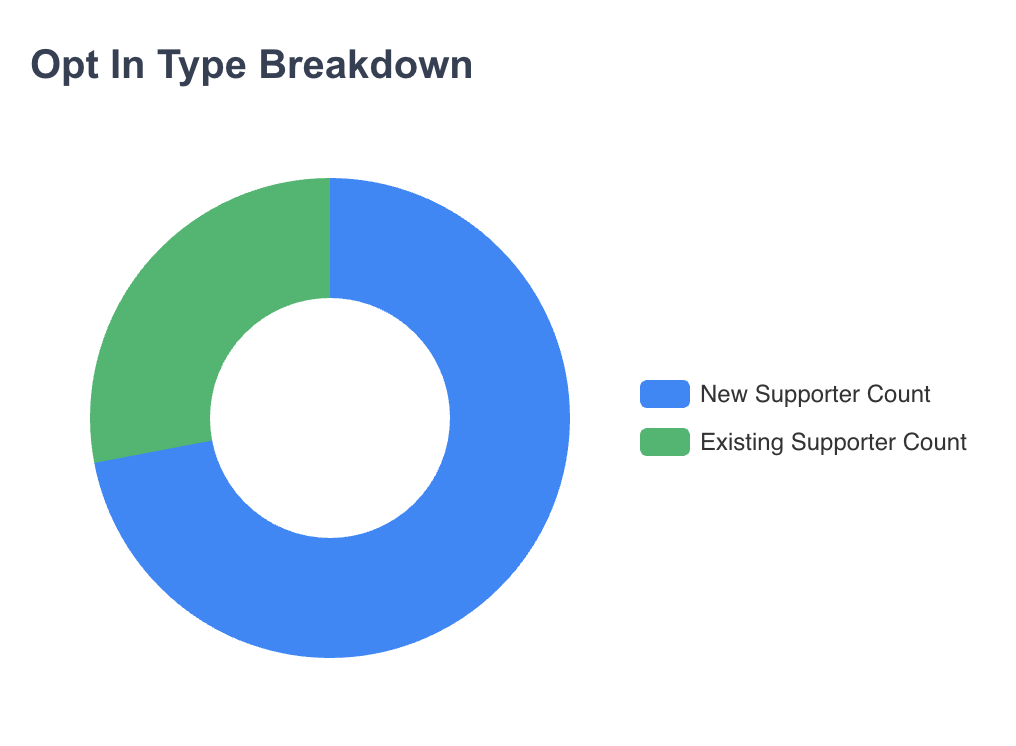
|
Percentage of new versus existing supporters who opted in |
Sample Data Reporting
|
Field |
Definition |
|---|---|
|
First Name |
The supporter’s first name. |
|
Last Name |
The supporter’s last name |
|
|
The supporter’s email address. |
|
City |
The city where the supporter resides. |
|
Region |
The state, province, or region of the supporter. |
|
Country |
The country where the supporter is located. |
|
Opt-in Date |
Date supporter opted in YYYY-MM-DD |
|
Time to First Action (Months) |
Number of months for supporter’s first action |
|
Total Actions |
Total actions |
|
Avg Time to Donate (Months) |
Number of months until supporter’s first donation |
|
Last Donation Date |
Date of last donation YYYY-MM-DD |
|
Last Donation Amount |
Amount of last donation (uses currency configured in Account Preferences) |
|
Highest Donation Amount |
Highest donation made by supporter |
|
Total Donation Amount |
Combined total giving for the supporter |
|
Avg Donation Amount |
Average donation for the supporter |
|
Is Recurring Donor? |
Yes/No |