
The main dashboard provides visual representations of data across multiple categories, making it easy to identify trends and patterns. This includes data from fundraising, advocacy, and email. In addition, this dashboard shows actionable insights. They are queries that Engaging Networks runs on either a daily or weekly basis to determine the performance of specific metrics. If there is a need, a notification will show to the user, enabling more informed decision making.
|
Widget |
Description |
Predefined Report |
|---|---|---|
|
Recurring Donations Trend 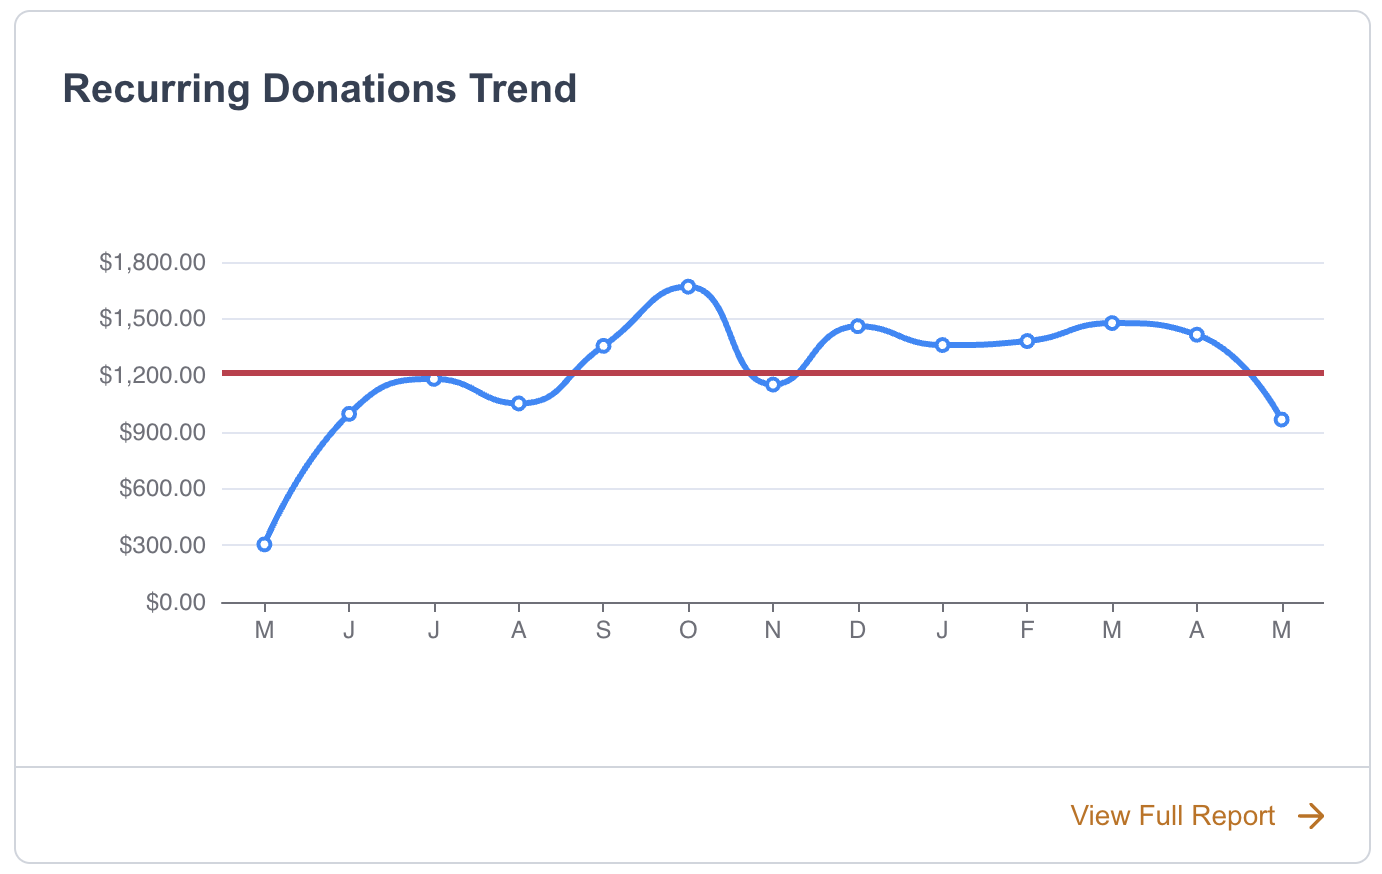
|
The total amount of recurring donations over time based on the selected segment, and date filter. Includes a trend line. Users can hover over this widget for more specific numbers. |
|
|
Total Raised - Cumulative 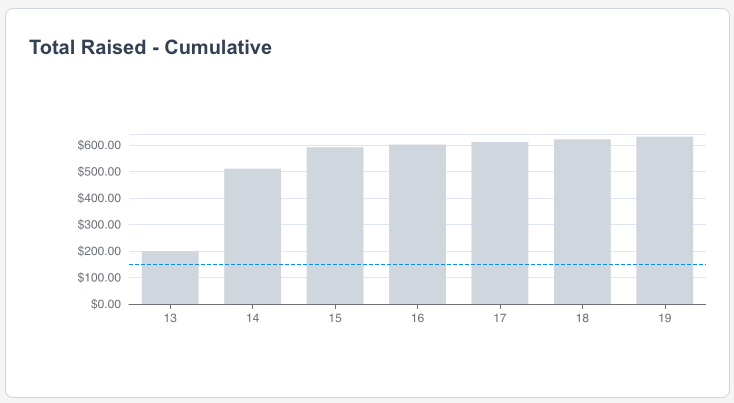
|
Tracks the total amount of revenue raised over time, accumulating each period’s donations to show overall growth and fundraising momentum. |
|
|
Unsubscribe Rate 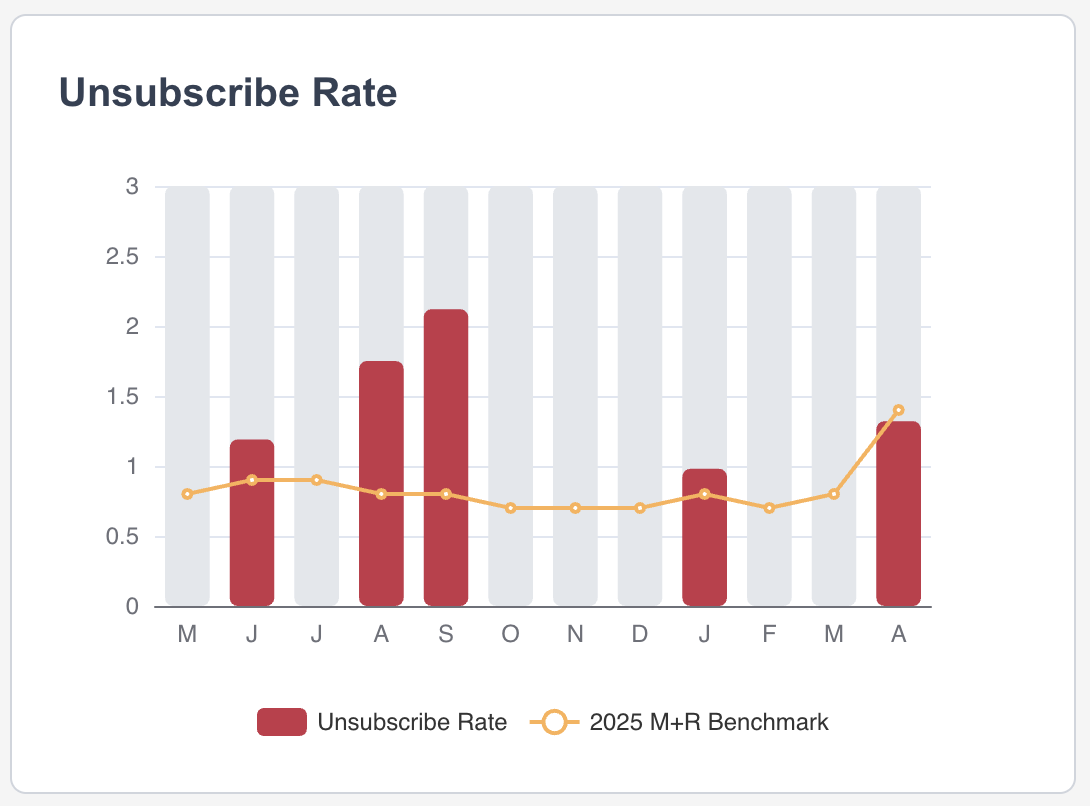
|
Measures the percentage of email recipients who opted out after receiving a campaign. Indicates email fatigue or relevance issues. |
|
|
Donor Retention 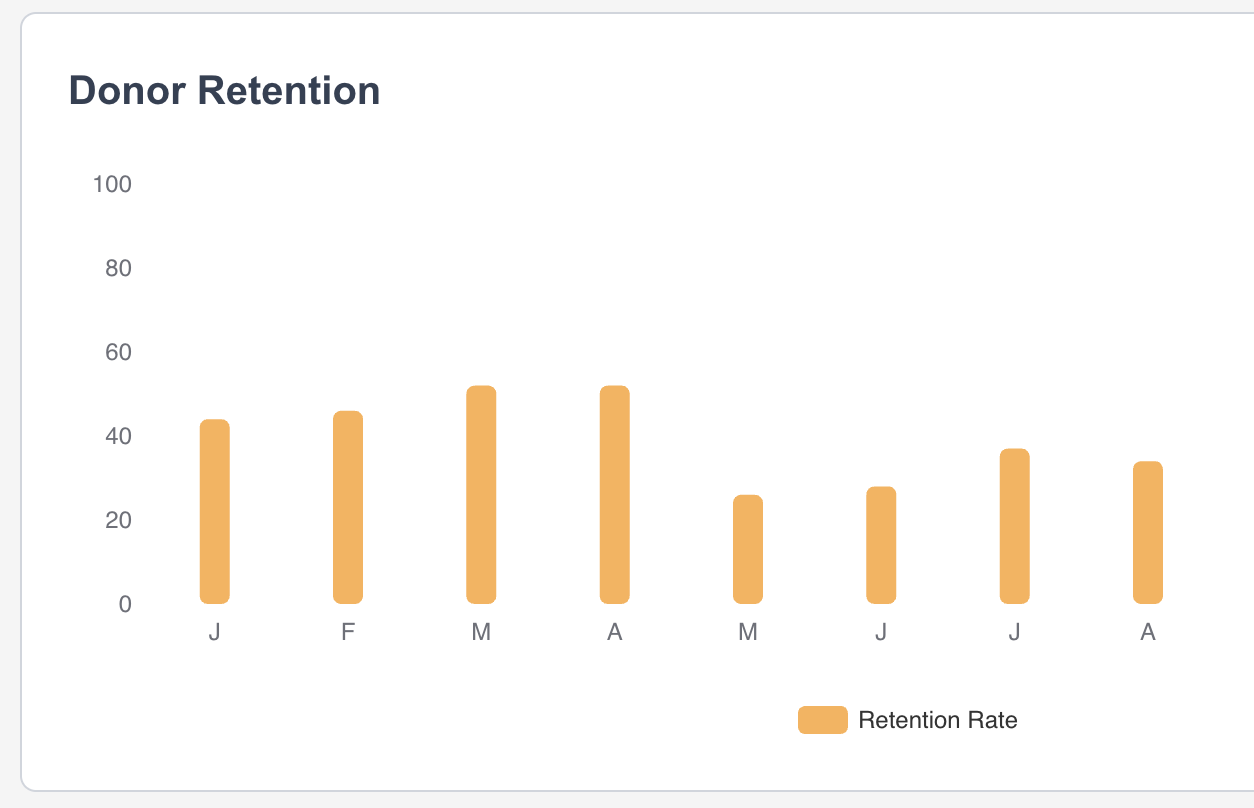
|
Represents the percentage of supporters who gave in the last 12 months, compared to the previous 12 months, reflecting donor loyalty and relationship strength.
|
|
|
Total Raised by Email 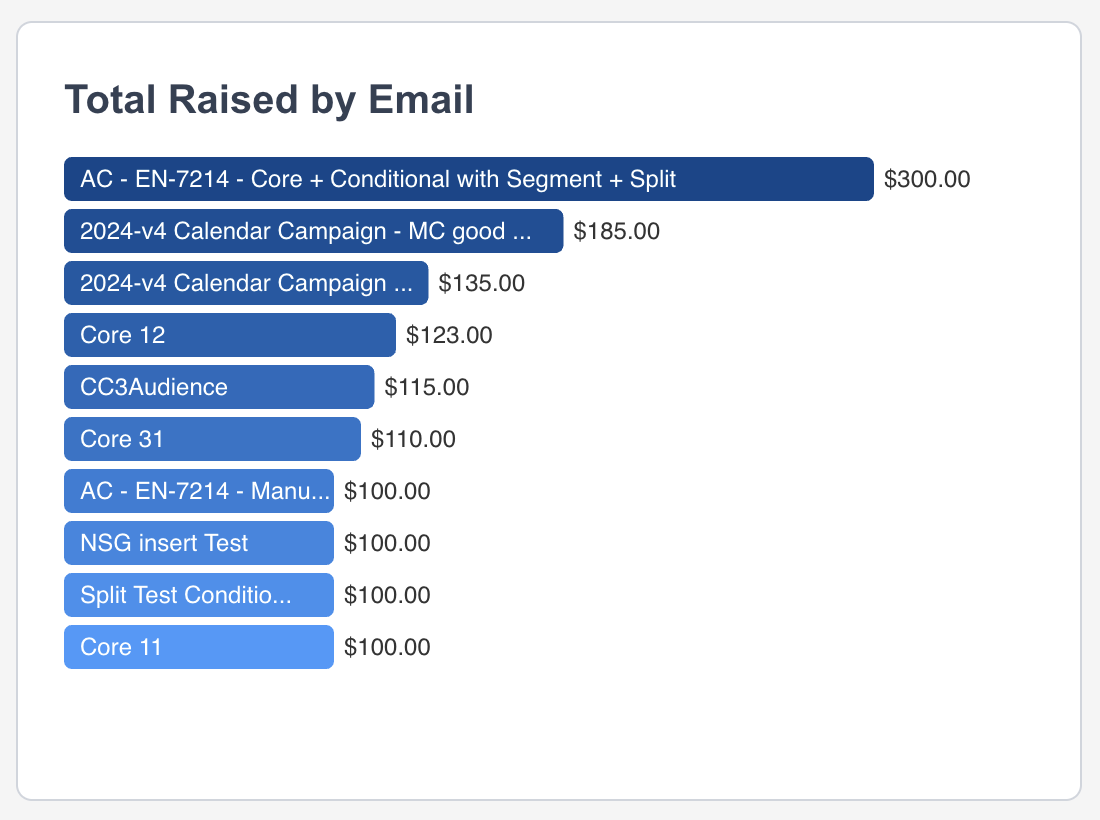
|
Breaks down total revenue generated directly from email campaigns (classic and MT) to assess their effectiveness in driving donations
|
|
|
Major Gifts 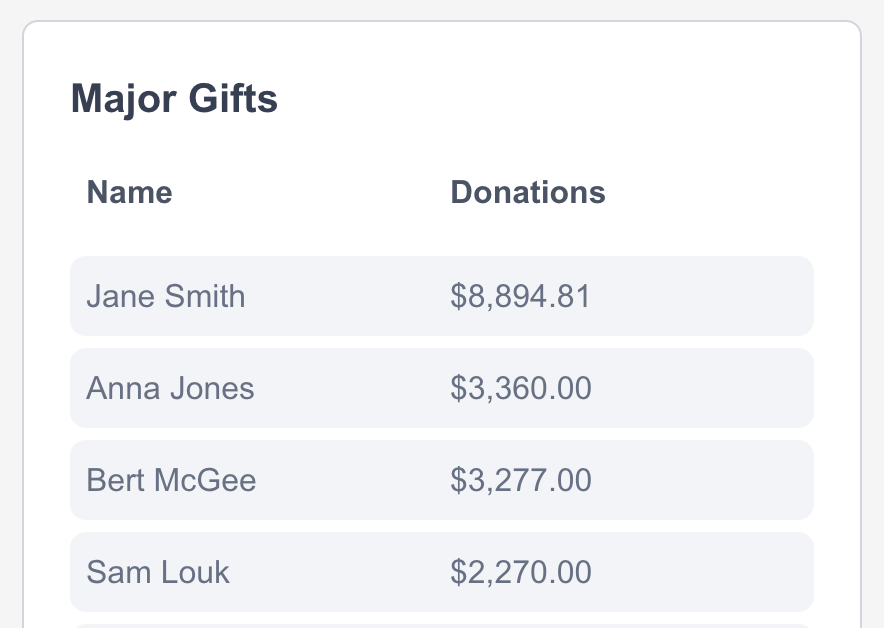
|
Shows donations from the top 10 supporters based on fundraising pages, providing insight into high-value donor contributions.
|
|
|
Event Fundraising Performance 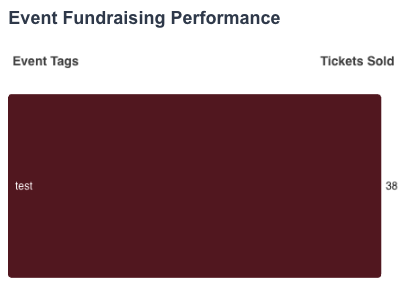
|
Displays the total tickets sold based on event tags to assess their success.
|
|
|
Actions Trend 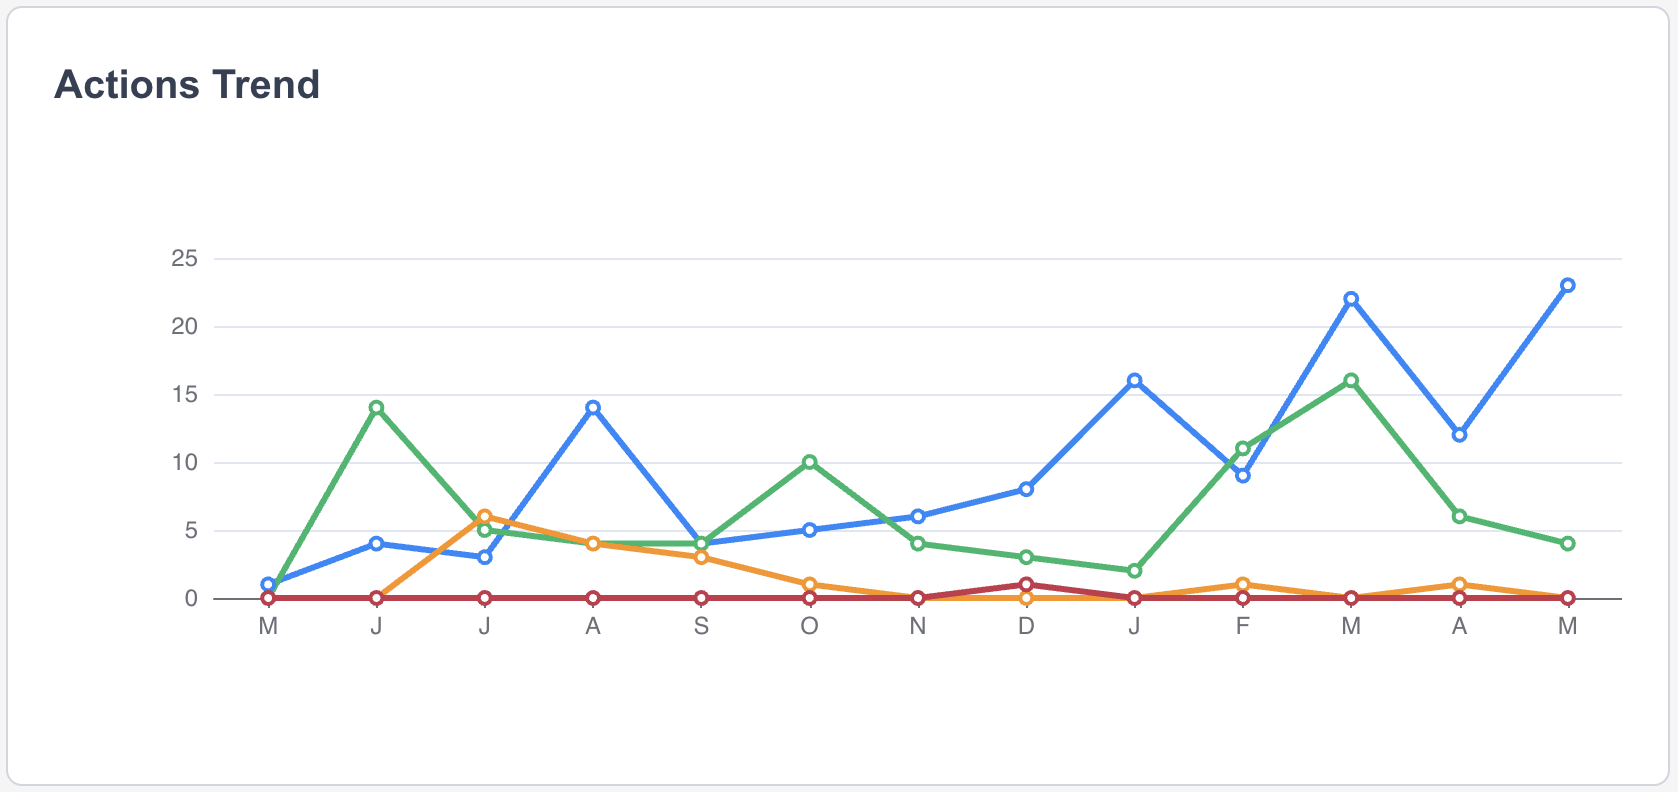
|
Shows trends over time in the number of supporter actions taken (e.g., petitions, form submissions), revealing advocacy engagement levels.
|