
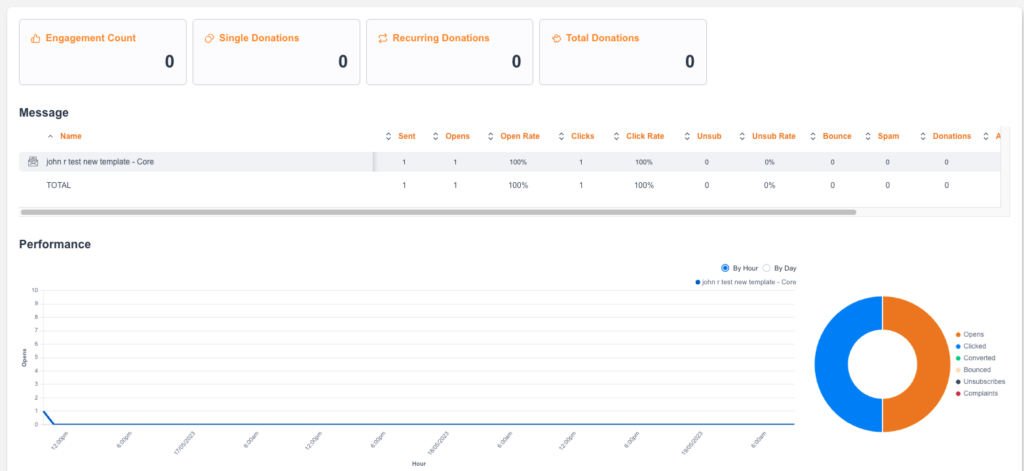
You can report on a Broadcast by clicking the Reporting stage when editing a broadcast, or by clicking on the reporting icon in the list of broadcasts under the Marketing Tools > Messaging > Broadcasts menu ![]()
|
Engagement Count |
The number of Data Captures, Sign Up, Survey, Ecards pages completed from the broadcast
|
|
Single Donations |
The number of one time donations made from donation pages linked in the broadcast |
|
Recurring Donations |
The number of recurring donations made from donation pages linked in the broadcast |
|
Total Donations |
The total number of donations (one time and recurring) made from donation pages linked in the broadcast |
Message list
This contains a list of any messages within the broadcast. You may only have one, but if you have used conditional content or split tests then multiple messages will be seen.
Each one will have scrollable statistics which can be downloaded as a CSV (top-right button):
|
Sent |
The number of supporters sent the message |
|
Opens |
The number of supporters who opened the email (unique) |
|
Open rate |
The percentage of opens |
|
Clicks |
The number of supporters who have clicked a link in your email or SMS (unique) |
|
Click Rate |
The percentage of clicks |
|
ADJ CTR |
The percentage of clicks out of the supporters who opened the email |
|
SMS Sent |
Number of sent SMS messages |
|
SMS Delivered |
Number of delivered SMS messages |
|
SMS Failed |
Number of failed SMS messages |
|
Unsub |
The number of supporters who clicked the unsubscribe link (unique) |
|
Unsub Rate |
The percentage of unsubscribes |
|
Bounce |
The number of hard bounces |
|
Bounce Rate |
The percentage of bounce |
|
Spam |
The number of supporters who marked the email as spam (unique) |
|
Donations |
The number of donations made from the message |
|
Advocacy count |
The number of advocacy actions made from the message. Advocacy page types include Click to Call, Email to Target, Petition, and X Post to Target. |
|
Engagement count |
The number of engagement actions made from the message. Engagement page types include Data Capture, Ecard, Email Signup, and Survey. |
Performance
This shows a line graph of opens over time. You can switch to By Hour or By Day
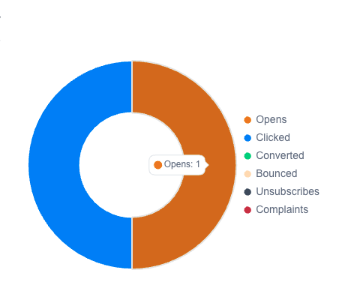
It also shows a pie chart showing the number of different types of activity – opens, clicks, converted, bounced, complaints. You can hover over the subject to view it:
This shows the number of clicks per link. If you have not named your link when adding it, a random code will show.
Links
This will show the name of the link (as it was named by a User when building the email), the URL, and the number of clicks on the link.